ESW Trend Tracker Software
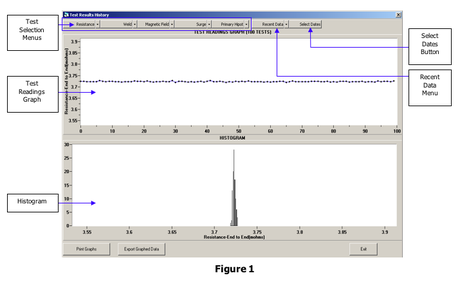
ESW recognizes that our test systems provide vital information our customers need to control and understand their process. We have developed our Trend Tracker Software to aid customers with total process control of their line. This software is designed to use information that the tester is gathering on every part tested. Information from all parts tested are stored by part number or other designator. Trend Tracker screens are simple and easy to navigate using drop down menus for each test to select the desired test data to view on the graphs. Once a test is selected, the Test Readings Graph and Histogram are updated automatically. These graphs show a graphic representation of the readings obtained for the selected test.
Data Selection & Gathering
|
|
Data Selection...
Test Summary Popup...
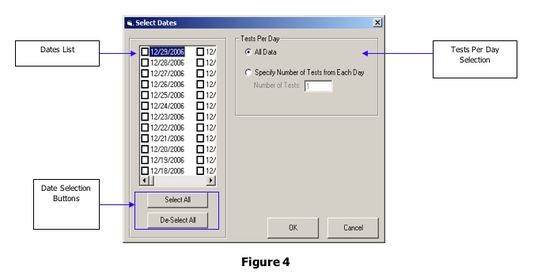
- The “Date List” above shows all of the dates that the selected part was tested and is used to select the date(s) whose data will be displayed on the Test Results History screen. If the box next to a date is checked, the data from that date will be displayed on the Test Results History screen. Click on the [Select All] button to check all of the dates listed in the Dates List or click [De-Select All] to uncheck all of the dates listed.
- The “Tests Per Day” section determines the number of data points or test results that will be taken from each date selected and displayed on the Test Results History screen. Select “All Data” to display all of the data from each of the dates selected. Select “Specify Number of Tests from Each Day” to define the number of tests that will be displayed from each day. In the box labeled “Number of Tests”, enter the number of tests. Click [OK] to return to the Test Results History screen and display the data from the selected date(s).
Test Summary Popup...
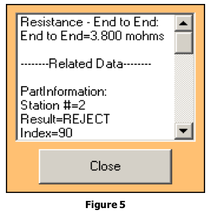
- Clicking on any point on the “Test Readings Graph” will bring up the test summary screen (below). This screen will show the value of the selected point, along with the part information (Part Number, Serial number, etc.), and the readings obtained for the other tests performed on the part.
Electronic Systems of Wisconsin
5020 21st Street Racine, WI. 53406 USA
+1 262-554-1211
[email protected]
www.eswtesters.com
5020 21st Street Racine, WI. 53406 USA
+1 262-554-1211
[email protected]
www.eswtesters.com